Examples
All examples use the same synthetic exam scores dataset. Run this setup block first:
import numpy as np
import pandas as pd
from interlace import fit

rng = np.random.default_rng(42)
n = 300
df = pd.DataFrame({
    "score":         60 + rng.normal(0, 8, n),
    "hours_studied": rng.uniform(0, 10, n),
    "prior_gpa":     rng.uniform(2.0, 4.0, n),
    "student_id":    [f"s{i}"   for i in rng.integers(1, 31, n)],
    "school_id":     [f"sch{i}" for i in rng.integers(1, 11, n)],
})

result = fit(
    formula="score ~ hours_studied + prior_gpa",
    data=df,
    groups=["student_id", "school_id"],
)
/tmp/ipykernel_2504/2983271922.py:15: UserWarning: boundary (singular) fit: see help(interlace.isSingular)
Single grouping factor
When you only have one source of clustering, pass a single column name:
result_single = fit(
    formula="score ~ hours_studied + prior_gpa",
    data=df,
    groups="student_id",
)

print(result_single.variance_components)
{'student_id': 5.56870629733604e-15}
/tmp/ipykernel_2504/1119454205.py:1: UserWarning: boundary (singular) fit: see help(interlace.isSingular)
Residuals
hlm_resid returns a DataFrame with .resid and .fitted columns alongside the
original data. Use type="marginal" to ignore random effects, or
type="conditional" to subtract predicted BLUPs.
from interlace import hlm_resid

# Marginal residuals: y - Xβ
marginal = hlm_resid(result, type="marginal")
print(marginal[[".resid", ".fitted"]].describe())
           .resid     .fitted
count  300.000000  300.000000
mean     0.011946   59.659422
std      7.437498    0.227064
min    -20.174799   59.184522
25%     -5.108415   59.489149
50%     -0.298385   59.674857
75%      4.091057   59.834520
max     23.883492   60.122249
# Conditional residuals: y - Xβ - Zû
conditional = hlm_resid(result, type="conditional")

# Standardised
std_resid = hlm_resid(result, type="conditional", standardized=True)

# Group-level random effects
school_re = hlm_resid(result, level="school_id")
print(school_re.head())
  school_id  .ranef.school_id
0      sch1     -2.196027e-16
1     sch10      4.091978e-15
2      sch2     -2.011151e-15
3      sch3     -7.297851e-16
4      sch4     -1.941025e-15
Leverage
The hat-matrix diagonal is decomposed into fixed-effect and random-effect components following Demidenko & Stukel (2005) and Nobre & Singer (2007).
from interlace import leverage

lev = leverage(result)
print(lev.columns)

# High-leverage observations
high_lev = lev[lev["overall"] > 2 * lev["overall"].mean()]
print(f"{len(high_lev)} high-leverage observations")
Index(['overall', 'fixef', 'ranef', 'ranef.uc'], dtype='str')
8 high-leverage observations
Influence diagnostics
hlm_influence fits the model n times with one observation (or group) deleted,
computing Cook’s D, MDFFITS, COVTRACE, COVRATIO, and RVC for each deletion.
from interlace import hlm_influence

# Observation-level influence
infl = hlm_influence(result, level=1)
print(infl.columns)
Index(['index', 'cooksd', 'mdffits', 'covtrace', 'covratio',
       'rvc.var_student_id', 'rvc.var_school_id', 'rvc.error_var'],
      dtype='str')
# Group-level influence (delete one school at a time)
school_infl = hlm_influence(result, level="school_id")
print(school_infl.head())
  school_id    cooksd   mdffits  covtrace  covratio  rvc.var_student_id  \
0      sch8  0.004501  0.004193  0.354035  1.388906            0.896488
1      sch3  0.009374  0.009049  0.100595  1.093911            0.721339
2      sch4  0.206810  0.173746  0.513685  1.604129            1.154534
3      sch7  0.137158  0.128713  0.202613  1.215891            0.981423
4      sch1  0.024287  0.023107  0.169026  1.178326            1.064261

   rvc.var_school_id  rvc.error_var
0       72543.870300       1.037814
1      196010.745081       0.970572
2       29112.229389       1.026198
3           0.976987       0.976987
4         110.628688       0.948675
Cook’s distance and MDFFITS
from interlace import cooks_distance, mdffits

cd  = cooks_distance(result)   # np.ndarray, shape (n,)
mdf = mdffits(result)          # np.ndarray, shape (n,)

print(f"Max Cook's D: {cd.max():.4f}")
Max Cook's D: 0.0297
Count and measure influential observations
from interlace import n_influential

# Count observations exceeding the 4/n heuristic threshold
n_inf = n_influential(result)
print(f"{n_inf} influential observations (Cook's D > 4/n)")
14 influential observations (Cook's D > 4/n)
Combined augmented DataFrame
hlm_augment is a convenience wrapper that returns a single DataFrame containing the
original data, conditional residuals, fitted values, and all influence statistics.
Useful for exploratory analysis or downstream filtering.
from interlace import hlm_augment

aug = hlm_augment(result)
print(aug.columns.tolist())
['score', 'hours_studied', 'prior_gpa', 'student_id', 'school_id', '.resid', '.fitted', 'index', 'cooksd', 'mdffits', 'covtrace', 'covratio', 'rvc.var_student_id', 'rvc.var_school_id', 'rvc.error_var']
# Find the most influential observations
aug.nlargest(5, "cooksd")[["student_id", "school_id", "score", "cooksd"]]
| student_id | school_id | score | cooksd | |
|---|---|---|---|---|
| 248 | s13 | sch1 | 83.240537 | 0.029652 |
| 190 | s20 | sch3 | 73.789326 | 0.025360 |
| 226 | s6 | sch6 | 80.139792 | 0.024535 |
| 292 | s29 | sch7 | 71.771936 | 0.022232 |
| 162 | s25 | sch10 | 77.027758 | 0.022188 |
# Skip the influence refit loop (faster, residuals only)
aug_fast = hlm_augment(result, include_influence=False)
print(aug_fast.columns.tolist())
['score', 'hours_studied', 'prior_gpa', 'student_id', 'school_id', '.resid', '.fitted']
Prediction on new data
df_new = pd.DataFrame({
    "hours_studied": [3.0, 7.0, 5.0],
    "prior_gpa":     [2.5, 3.8, 3.1],
    "student_id":    ["s1", "s2", "s_new"],  # s_new is unseen
    "school_id":     ["sch1", "sch1", "sch_new"],
})

# Conditional prediction (known BLUPs applied, unknown → 0)
y_hat = result.predict(newdata=df_new)
print(y_hat)

# Fixed-effects only (population-level)
y_fe = result.predict(newdata=df_new, include_re=False)
print(y_fe)
[61.06190672 58.94254552 59.61606745]
[59.74480774 59.45503414 59.61606745]
Plotting
All plots return plotnine.ggplot objects and can be further customised with
standard plotnine layers.
Residual plots
from interlace import plot_resid

resid_df = hlm_resid(result, type="conditional")
plot_resid(resid_df, type="resid_vs_fitted")
---------------------------------------------------------------------------
ModuleNotFoundError                       Traceback (most recent call last)
File ~/work/interlace/interlace/.venv/lib/python3.13/site-packages/plotnine/stats/smoothers.py:356, in loess(data, xseq, params)
    355 try:
--> 356     from skmisc.loess import loess as loess_klass
    357 except ImportError as e:

ModuleNotFoundError: No module named 'skmisc'

The above exception was the direct cause of the following exception:

PlotnineError                             Traceback (most recent call last)
File ~/work/interlace/interlace/.venv/lib/python3.13/site-packages/IPython/core/formatters.py:1036, in MimeBundleFormatter.__call__(self, obj, include, exclude)
   1033     method = get_real_method(obj, self.print_method)
   1035     if method is not None:
-> 1036         return method(include=include, exclude=exclude)
   1037     return None
   1038 else:

File ~/work/interlace/interlace/.venv/lib/python3.13/site-packages/plotnine/ggplot.py:172, in ggplot._repr_mimebundle_(self, include, exclude)
    169     self.theme = self.theme.to_retina()
    171 buf = BytesIO()
--> 172 self.save(buf, "png" if format == "retina" else format, verbose=False)
    173 figure_size_px = self.theme._figure_size_px
    174 return get_mimebundle(buf.getvalue(), format, figure_size_px)

File ~/work/interlace/interlace/.venv/lib/python3.13/site-packages/plotnine/ggplot.py:681, in ggplot.save(self, filename, format, path, width, height, units, dpi, limitsize, verbose, **kwargs)
    632 def save(
    633     self,
    634     filename: Optional[str | Path | BytesIO] = None,
   (...)    643     **kwargs: Any,
    644 ):
    645     """
    646     Save a ggplot object as an image file
    647
   (...)    679         Additional arguments to pass to matplotlib `savefig()`.
    680     """
--> 681     sv = self.save_helper(
    682         filename=filename,
    683         format=format,
    684         path=path,
    685         width=width,
    686         height=height,
    687         units=units,
    688         dpi=dpi,
    689         limitsize=limitsize,
    690         verbose=verbose,
    691         **kwargs,
    692     )
    694     with plot_context(self).rc_context:
    695         sv.figure.savefig(**sv.kwargs)

File ~/work/interlace/interlace/.venv/lib/python3.13/site-packages/plotnine/ggplot.py:629, in ggplot.save_helper(self, filename, format, path, width, height, units, dpi, limitsize, verbose, **kwargs)
    626 if dpi is not None:
    627     self.theme = self.theme + theme(dpi=dpi)
--> 629 figure = self.draw(show=False)
    630 return mpl_save_view(figure, fig_kwargs)

File ~/work/interlace/interlace/.venv/lib/python3.13/site-packages/plotnine/ggplot.py:306, in ggplot.draw(self, show)
    304 with plot_context(self, show=show):
    305     figure = self._setup()
--> 306     self._build()
    308     # setup
    309     self.axs = self.facet.setup(self)

File ~/work/interlace/interlace/.venv/lib/python3.13/site-packages/plotnine/ggplot.py:393, in ggplot._build(self)
    390 layout.map_position(layers)
    392 # Apply and map statistics
--> 393 layers.compute_statistic(layout)
    394 layers.map_statistic(self)
    396 # Prepare data in geoms
    397 # e.g. from y and width to ymin and ymax

File ~/work/interlace/interlace/.venv/lib/python3.13/site-packages/plotnine/layer.py:489, in Layers.compute_statistic(self, layout)
    487 def compute_statistic(self, layout: Layout):
    488     for l in self:
--> 489         l.compute_statistic(layout)

File ~/work/interlace/interlace/.venv/lib/python3.13/site-packages/plotnine/layer.py:293, in layer.compute_statistic(self, layout)
    291 data = self.stat.use_defaults(data)
    292 data = self.stat.setup_data(data)
--> 293 data = self.stat.compute_layer(data, layout)
    294 self.data = data

File ~/work/interlace/interlace/.venv/lib/python3.13/site-packages/plotnine/stats/stat.py:303, in stat.compute_layer(self, data, layout)
    300     pscales = layout.get_scales(pdata["PANEL"].iloc[0])
    301     return self.compute_panel(pdata, pscales)
--> 303 return groupby_apply(data, "PANEL", fn)

File ~/work/interlace/interlace/.venv/lib/python3.13/site-packages/plotnine/_utils/__init__.py:571, in groupby_apply(df, cols, func, *args, **kwargs)
    567 lst = []
    568 for _, d in df.groupby(cols, observed=True):
    569     # function fn should be free to modify dataframe d, therefore
    570     # do not mark d as a slice of df i.e no SettingWithCopyWarning
--> 571     lst.append(func(d, *args, **kwargs))
    572 return pd.concat(lst, axis=axis, ignore_index=True)

File ~/work/interlace/interlace/.venv/lib/python3.13/site-packages/plotnine/stats/stat.py:301, in stat.compute_layer.<locals>.fn(pdata)
    299     return pdata
    300 pscales = layout.get_scales(pdata["PANEL"].iloc[0])
--> 301 return self.compute_panel(pdata, pscales)

File ~/work/interlace/interlace/.venv/lib/python3.13/site-packages/plotnine/stats/stat.py:335, in stat.compute_panel(self, data, scales)
    333 stats = []
    334 for _, old in data.groupby("group"):
--> 335     new = self.compute_group(old, scales)
    336     new.reset_index(drop=True, inplace=True)
    337     unique = uniquecols(old)

File ~/work/interlace/interlace/.venv/lib/python3.13/site-packages/plotnine/stats/stat_smooth.py:235, in stat_smooth.compute_group(self, data, scales)
    232         rangee = [data["x"].min(), data["x"].max()]
    233     xseq = np.linspace(rangee[0], rangee[1], n)
--> 235 return predictdf(data, xseq, self.params)

File ~/work/interlace/interlace/.venv/lib/python3.13/site-packages/plotnine/stats/smoothers.py:53, in predictdf(data, xseq, params)
     47     msg = (
     48         "'method' should either be a string or a function"
     49         "with the signature `func(data, xseq, params)`"
     50     )
     51     raise PlotnineError(msg)
---> 53 return method(data, xseq, params)

File ~/work/interlace/interlace/.venv/lib/python3.13/site-packages/plotnine/stats/smoothers.py:359, in loess(data, xseq, params)
    357 except ImportError as e:
    358     msg = "For loess smoothing, install 'scikit-misc'"
--> 359     raise PlotnineError(msg) from e
    361 try:
    362     weights = data["weight"]

PlotnineError: "For loess smoothing, install 'scikit-misc'"
<plotnine.ggplot.ggplot object at 0x7f91173a4170>
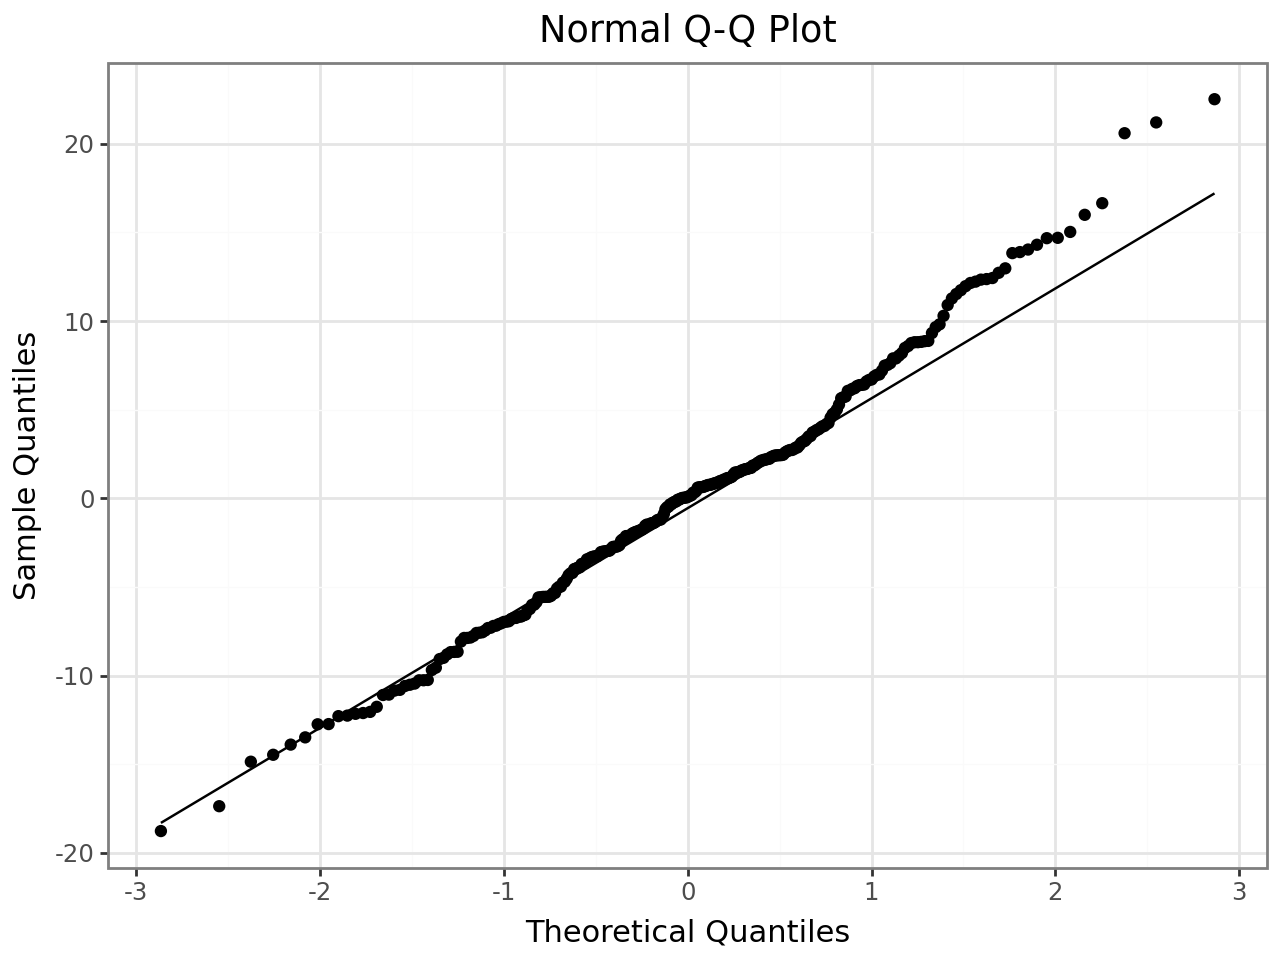
plot_resid(resid_df, type="qq")
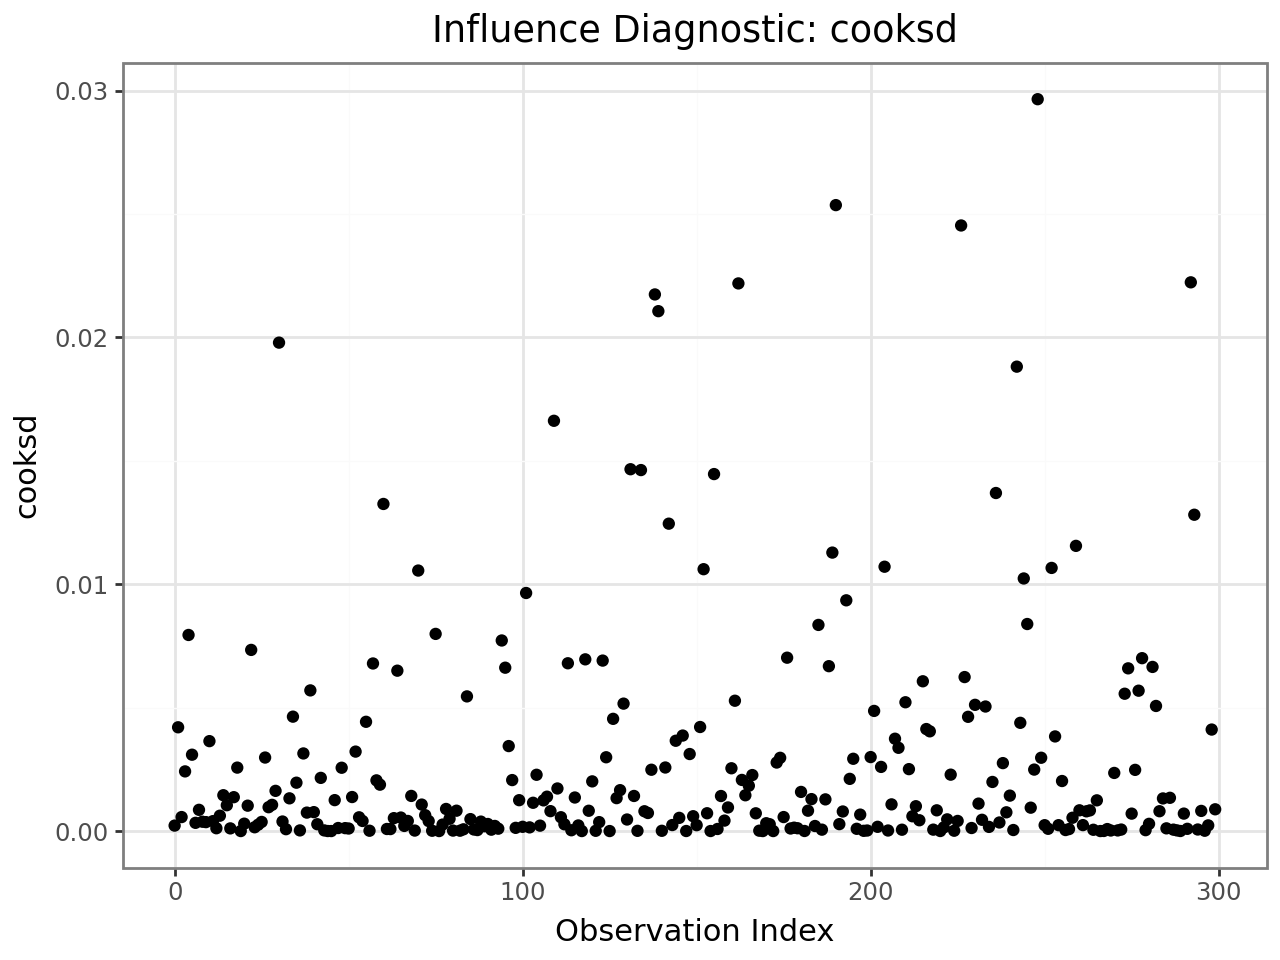
Influence index plot
from interlace import plot_influence

plot_influence(infl, diag="cooksd")
plot_influence(infl, diag="mdffits")

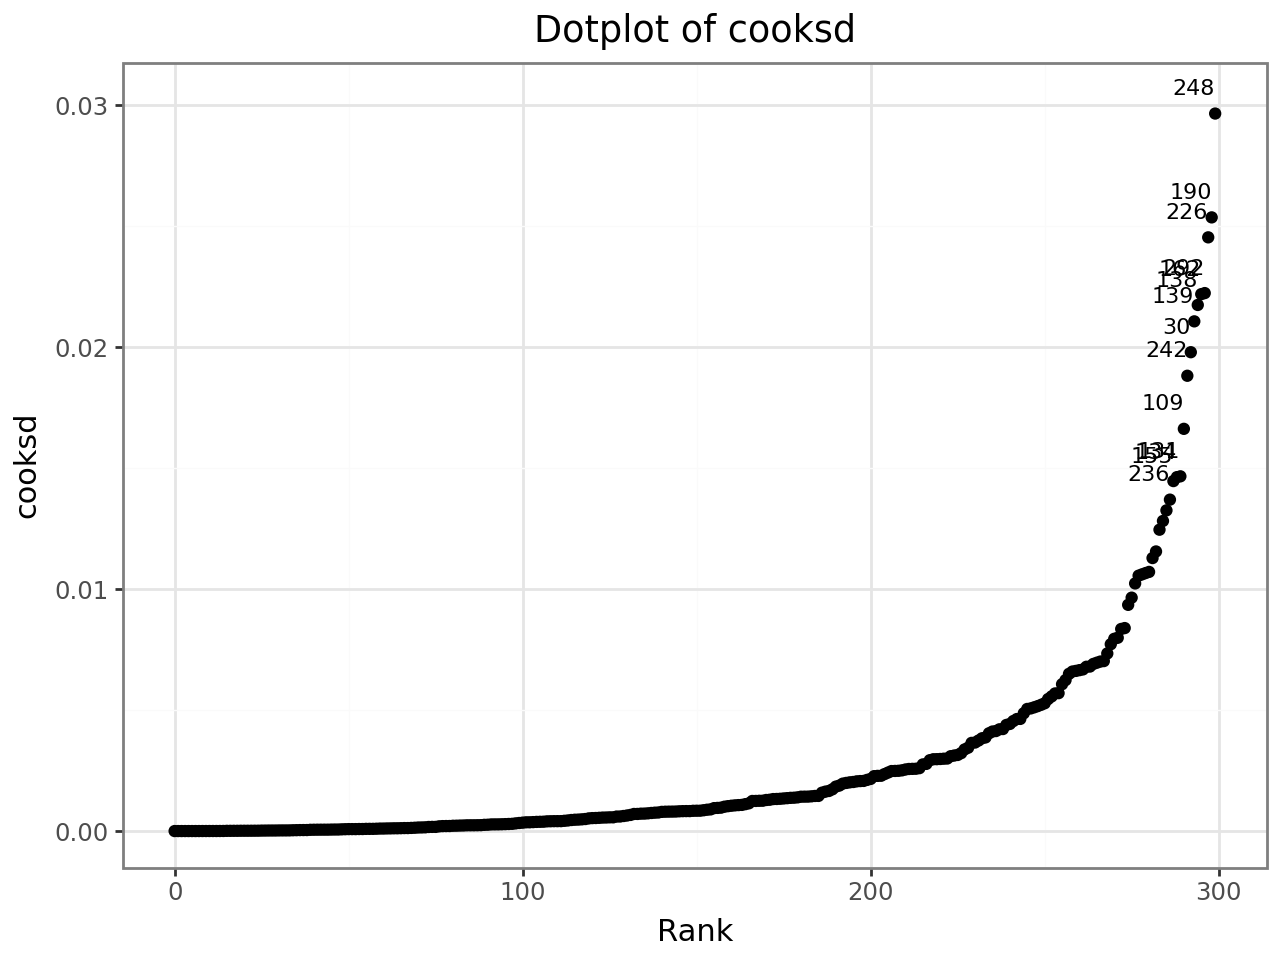
Ranked dotplot with outlier labels
dotplot_diag ranks observations by the chosen diagnostic and labels any that
exceed 3 × IQR above Q3.
from interlace import dotplot_diag

dotplot_diag(infl, diag="cooksd", cutoff="internal", name="index")
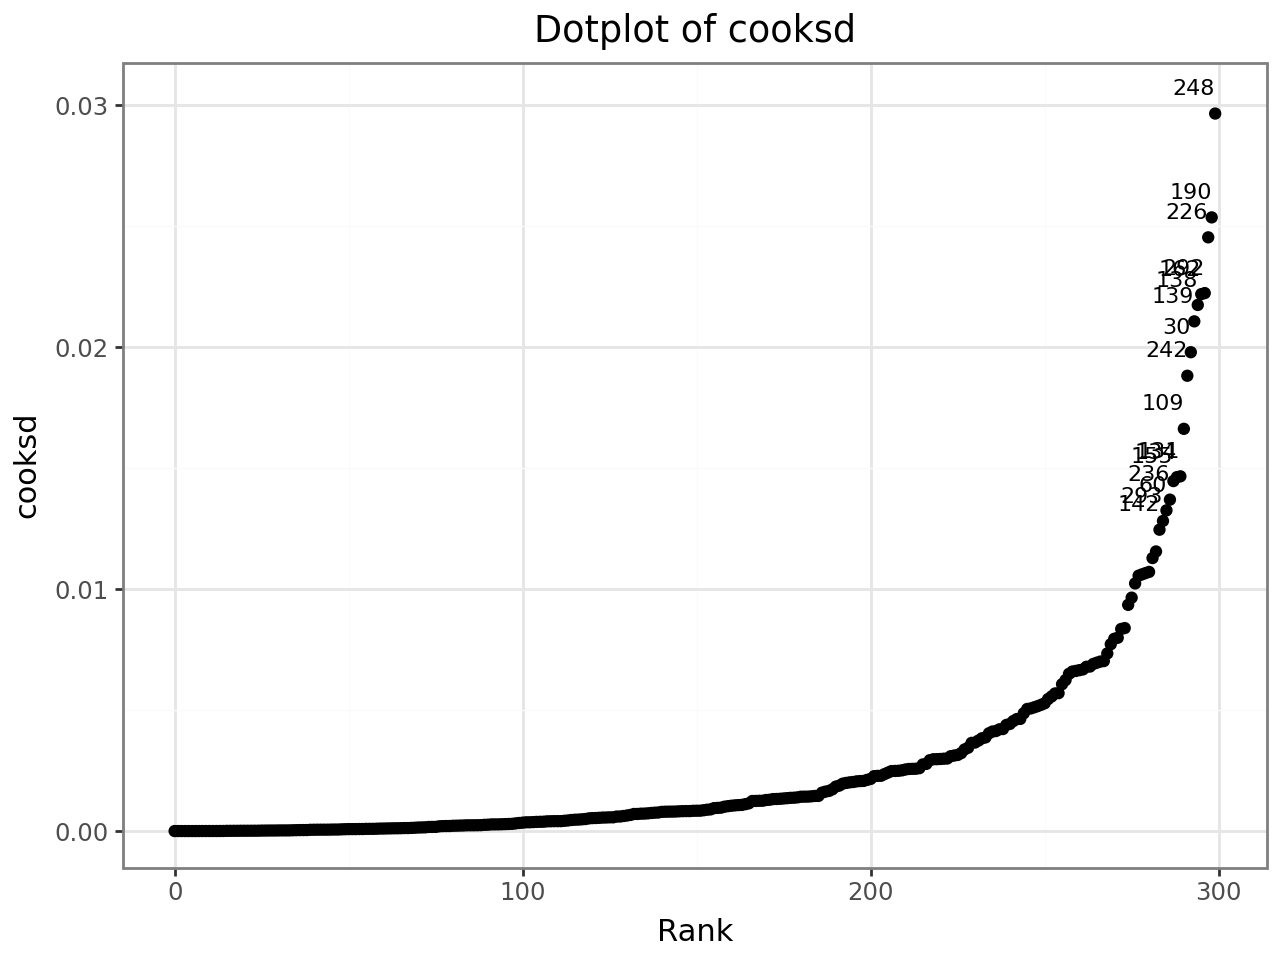
dotplot_diag(infl, diag="cooksd", cutoff=4 / len(df))